
It’s the second huge crisis in 12 years period when the GDP is shrinking and an unemployment is sky rocketing. Repeatedly chosen action from governments is to blow the balloon of newly printed money and borrow as much as they can. By listening to Mr. Powell and Mr. Mnuchin speeches reflecting selection of crisis measures, seems that decisions are adequate and right for such critical moment. But sizing the situation by government actions, this crisis moment is lasting at least a decade, when government requests us to rely on their monetary and fiscal measures. Do we really trust in their steps?
According to official numbers we already for few decades are experiencing a remarkable economic growth, innovation changes and of course increasing personal prosperity. I cannot argue with that when comparing absolute measures and changes that broad a new normal to our everyday life. With a smart phone I can do many things way differently and much more easily, I can travel much more often as airline businesses found the way to reduce costs, I can work on the other level of efficiency as using smart devises makes it possible. However relative numbers might suggest that this prosperity is closer to the mirage, especially when we talk about value measures not dependent on one government or essentially basic good as the roof over the head.
Not all countries are fortunate to print as much money as they want to or to borrow probably without any limits. However we do have some exceptions such as Norway, Switzerland and of course one of the most apparent – USA. For this reason in the article I’ll closer stick to USA story and data as it looks more straight forward example for expressing the concern in relation to money printing and borrowing.
For the start let’s take a look at the chart with USA monetary base, which I would name as printed money in different forms. The official term describes it as the total amount of a currency that is either in general circulation in the hands of the public or in the commercial bank deposits held in the central bank’s reserves.
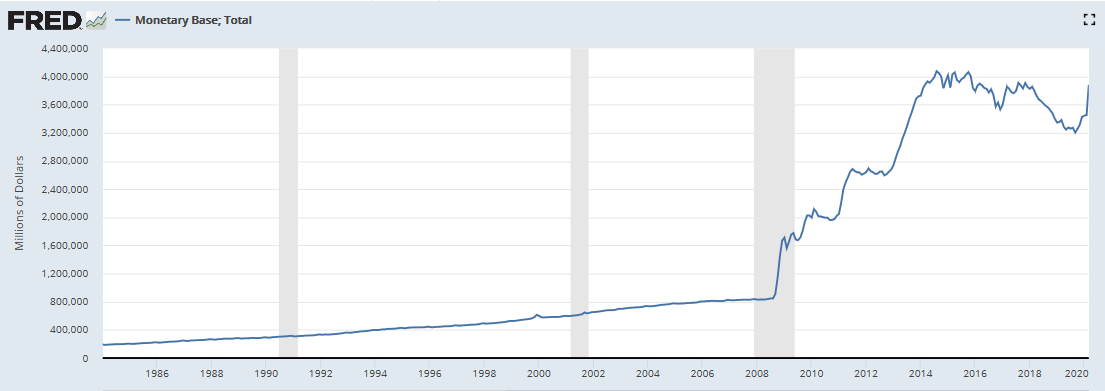
It’s fairly easy to notice that drastic changes in money printing began during financial crisis of 2008 and kept up exponential increase for 10 years. Money printing was stabilized in 2018 and 2019 but with a new shock of COVD-19 pandemic the printing game begins from the start. We can just guess how fast the monetary base will grow this time but taking into account FED move to do everything what markets need it looks like sky is the limit.
The big part of these fresh and new funds are staying in financial institutions to keep financial markets liquidity alive. Other huge slice of the money pie goes to extend credit limits for big part of private and government companies for them simply not to default and stay alive during the crisis with a hope to save some jobs.
But the reality of the salvation plan is quite unpleasant – unemployment rate for this day in USA reached 20%.
If for a moment we dissociate from current COVID-19 crisis, from a holistic point of view a more than a decade lasted money and credit bubble should be adequately reflected by the rapidly expanding economy itself. However, looking into data reflecting GDP growth, alternative value measures and relative comparisons, seems like most of the government help measures are dedicated to patch up old wounds and cover expenses not related with a dreamed economic prosperity of citizens.
For the record, I would like to say that I’m not a supporter of a data generalization principal because in reality many important circumstances are hidden in details. But when the data set is covering extended period of time and absolute or relative comparisons differ in times, I believe it doesn’t confront the fairness of conclusions. Let’s take a fair look at the numbers from last 36 years (full table disclosed at the end of the article).
Comparing absolute measures from the year of 1984 till 2019 such as real GDP (grew 150%), median house price in USA (grew 309%), gold price (grew 393%) and public debt (1295%) lowest change was spotted in GDP growth. This disproportion is grounding the fact of a fundamental and significant inflation compared with the GDP growth.
What made it less noted for people, is an increase of personal income which was around 250%. It’s a pity, that a change of income isn’t covering a price increase. In 1984 you were able to buy a house for 259 ounce of gold or a full amount of personal annual income of 5 and a half years. And after 36 years of progress you need to spend one more year of your incomes extra to buy the house. Moreover, its price as gold equivalent became 215 ounces.
If you didn’t buy the gold at that time and your savings are kept in dollars, your life from core valuation measures became less valuable. And this situation begins to smells very fishy when we take into the account how wonderfully governments were and are chanting about our growth, progress and prosperity.
The situation becomes simply inadequate when we add to the comparison debt numbers. Even acknowledging the reality that government isn’t spending only on projects with positive NPV (net present value), partly financing socially responsible, health related and nature friendly projects that might not give any measurable benefit at all.
Leaving presumptions of dis-balanced government budget behind let’s do the math: the GDP during 36 years grew by 2.5 times as total debt by 14 times and debt divided to each resident of USA increased 10 times. I won’t try to figure out how you can borrow one dollar for future and suddenly when the future comes you are left with just 18 cents. But the only reasonable conclusion is simply wasting all of it and wasting in big time. Spending on power games with no dividends such as wars, the security and prestige or just to keep all bureaucracy going.
It looks terrifying when you think that country spent so much money but majority of people are kept at the same relevant standard of living as they used to be 36 years ago. New IT solutions mostly can just comfort you but the reality is still without health insurance for all citizens. Most of dividends for trillion dollars’ worth investments sank in the hands of elite. And year after year Congress and White House is plaining debt ceiling game for the public to look very reasonable and respectful by increase a deficit.
The regular person at the end of the day is in the situation when getting one of a fundamental pieces of life such as house became harder, value of dollars he owns is relative lower and he, in the name of his government, owns 10 times more than he used to own.
After absorbing this illusionary image I’m asking. Do I really trust in my countries politics and their decisions? Is value of money they tell me to believe correct?
Probably most of us will still answer to these questions with a big yes. Simply because an instability terrifies us more than anything. We will rely on authorities till the end. This mental situation is classically explored by Albert Camus in the book “Plague”. When everyone simply ignores the reality and pretends that there is nothing to notice even when rats are all over the place. Most important goal – to keep everything stable.
But “BOOMS” are happening sooner or later. This mirage can be blown away just in few moments and I hopefully think that blindness weren’t covering all of us and all the time. Good luck with your own decisions!
|
Year |
Real GDP of USA (trn.) | Median USA house price (thsd.) | Gold price (USD/oz) | Mean personal income in USA (thsd.) | Total public debt of USA (mln.) | House price in annual income | House price in gold oz |
Debt per person |
|
1984 |
7633,00 | 79,90 | 309,00 | 14,41 | 1662966 | 5,54 | 259 | 7035 |
| 1985 | 7951,00 | 86,80 | 327 | 15,32 | 1945942 | 5,66 | 265 | 8159 |
| 1986 | 8226,00 | 95,00 | 390,9 | 16,17 | 2214835 | 5,87 | 243 | 9202 |
| 1987 | 8511,00 | 111,50 | 486,5 | 17,04 | 2431715 | 6,54 | 229 | 10014 |
| 1988 | 8867,00 | 113,90 | 410,15 | 18,05 | 2684392 | 6,31 | 278 | 10954 |
| 1989 | 9192,00 | 124,80 | 401 | 19,35 | 2952994 | 6,45 | 311 | 11937 |
| 1990 | 9366,00 | 121,50 | 391 | 19,84 | 3364820 | 6,12 | 311 | 13450 |
| 1991 | 9355,00 | 120,00 | 353,4 | 20,28 | 3801698 | 5,92 | 340 | 14995 |
| 1992 | 9685,00 | 126,00 | 332,9 | 20,76 | 4177009 | 6,07 | 378 | 16258 |
| 1993 | 9952,00 | 127,00 | 390,65 | 22,20 | 4535687 | 5,72 | 325 | 17426 |
| 1994 | 10352,00 | 132,00 | 382,5 | 23,28 | 4800150 | 5,67 | 345 | 18220 |
| 1995 | 10630,00 | 138,00 | 386,7 | 24,21 | 4988665 | 5,70 | 357 | 18713 |
| 1996 | 11031,00 | 144,10 | 369,55 | 25,47 | 5323172 | 5,66 | 390 | 19736 |
| 1997 | 11522,00 | 144,20 | 289,2 | 27,02 | 5502388 | 5,34 | 499 | 20158 |
| 1998 | 12038,00 | 153,00 | 287,45 | 28,24 | 5614217 | 5,42 | 532 | 20330 |
| 1999 | 12611,00 | 165,30 | 290,85 | 29,68 | 5776091 | 5,57 | 568 | 20679 |
| 2000 | 13131,00 | 172,90 | 272,65 | 31,20 | 5662216 | 5,54 | 634 | 20050 |
| 2001 | 13262,00 | 171,10 | 276,5 | 32,10 | 5943439 | 5,33 | 619 | 20838 |
| 2002 | 13493,00 | 190,10 | 342,75 | 32,22 | 6405707 | 5,90 | 555 | 22246 |
| 2003 | 13879,00 | 198,80 | 417,25 | 32,98 | 6997964 | 6,03 | 476 | 24079 |
| 2004 | 14406,00 | 228,80 | 438 | 33,86 | 7596143 | 6,76 | 522 | 25902 |
| 2005 | 14913,00 | 243,60 | 513 | 35,50 | 8170413 | 6,86 | 475 | 27603 |
| 2006 | 15338,00 | 245,40 | 635,7 | 37,52 | 8680224 | 6,54 | 386 | 29049 |
| 2007 | 15626,00 | 238,40 | 836,5 | 38,17 | 9229172 | 6,25 | 285 | 30591 |
| 2008 | 15605,00 | 222,50 | 865 | 38,38 | 10699805 | 5,80 | 257 | 35134 |
| 2009 | 15209,00 | 219,00 | 1104 | 38,21 | 12311349 | 5,73 | 198 | 40071 |
| 2010 | 15599,00 | 224,30 | 1410,25 | 38,33 | 14025215 | 5,85 | 159 | 45276 |
| 2011 | 15841,00 | 221,10 | 1574,5 | 39,66 | 15222940 | 5,57 | 140 | 48790 |
| 2012 | 16197,00 | 251,70 | 1664 | 40,56 | 16432730 | 6,21 | 151 | 52298 |
| 2013 | 16495,00 | 273,60 | 1201,5 | 42,39 | 17156119 | 6,45 | 228 | 54230 |
| 2014 | 16912,00 | 298,90 | 1199,25 | 42,79 | 18141444 | 6,99 | 249 | 56936 |
| 2015 | 17404,00 | 302,50 | 1060,2 | 44,51 | 18922179 | 6,80 | 285 | 58963 |
| 2016 | 17689,00 | 310,90 | 1151,7 | 46,55 | 19976827 | 6,68 | 270 | 61812 |
| 2017 | 18108,00 | 337,90 | 1296,5 | 48,99 | 20492747 | 6,90 | 261 | 63012 |
| 2018 | 18638,00 | 322,80 | 1281,65 | 50,41 | 21974096 | 6,40 | 252 | 67210 |
| 2019 | 19073,00 | 327,10 | 1523 | No data | 23201380 | No data | 215 | 70622 |
| Change ’84-’19 | 150% | 309% | 393% | 250% | 1295% | 15% | -17% |
904% |
| Data sources: Federal Reserve Economic Data https://fred.stlouisfed.org, Gold prices https://www.macrotrends.net/ | ||||||||